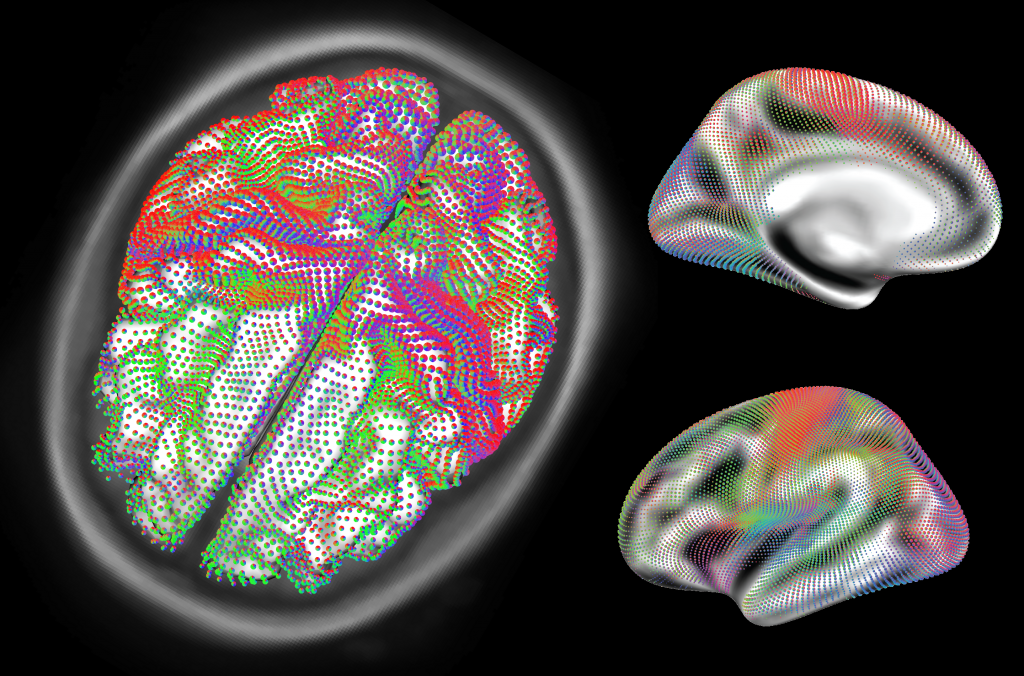
We render small iconic presentations (glyphs) of the distribution of functional connections at each of 20484 surface points of a cortical representation. The image is generated using resting state fMRI data. We calculate connection strengths between pairs of points based on similarity in intrinsic activity fluctuations. The little pie chart glyphs visualize the orientation of connected points as seen from the position of the glyph: red color encodes connections towards the left or the right, green towards the front or the back, and blue upwards or downwards. The visualization method shows several functional networks of connected areas. The sensorimotor cortex, for example, is visible as a large symmetrical reddish belt structure, due to its strong connectivity between the left and the right hemisphere. The image is rendered using braingl, a software available at code.google.com/p/braingl, which enables interactive exploration of highly complex visualizations through the use of graphics hardware shaders.
The Neuro Bureau
neuro-collaboration in action

