Michiel Kleinnijenhuis FMRIB-Wellcome Centre for Integrative Neuroimaging
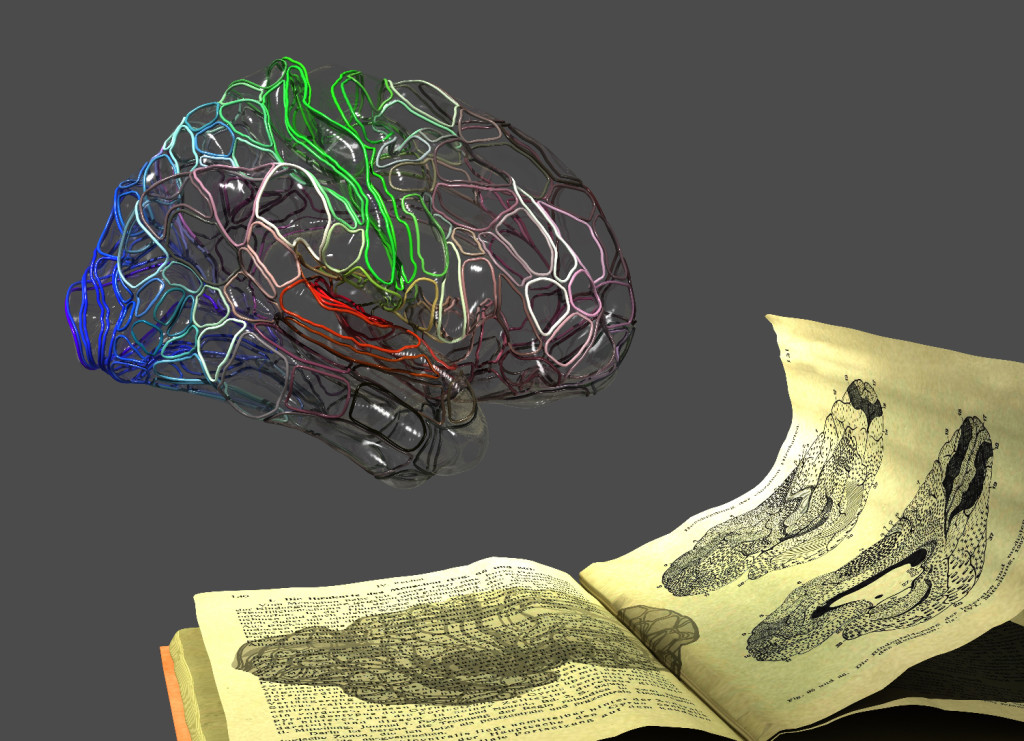
One of the most iconic images in the history of human brain mapping is shown together with a modern subdivision of the human cerebral cortex. The new model of the brain casts a shadow on the old description, while the old scheme is still found reflected in the new approach. The old map on the right page of the book was created at the start of the 20th century by Korbinian Brodmann (1909) by staining brain specimens and identifying 52 distinct regions on the basis of the layered structure of the cortex. The wireframe over the glass-brain model hovering above visualizes the 180 regions of the right hemisphere derived by Glasser and colleagues (2016) from a combination of MRI techniques using the many subjects of the Human Connectome Project (https://balsa.wustl.edu/study/show/RVVG). The colour scheme indicates what functions the regions are involved in where red corresponds to auditory, green to sensory-motor, blue to visual, "while moving towards white and black indicates involvement in "task-positive" and "task-negative" brain states", respectively.