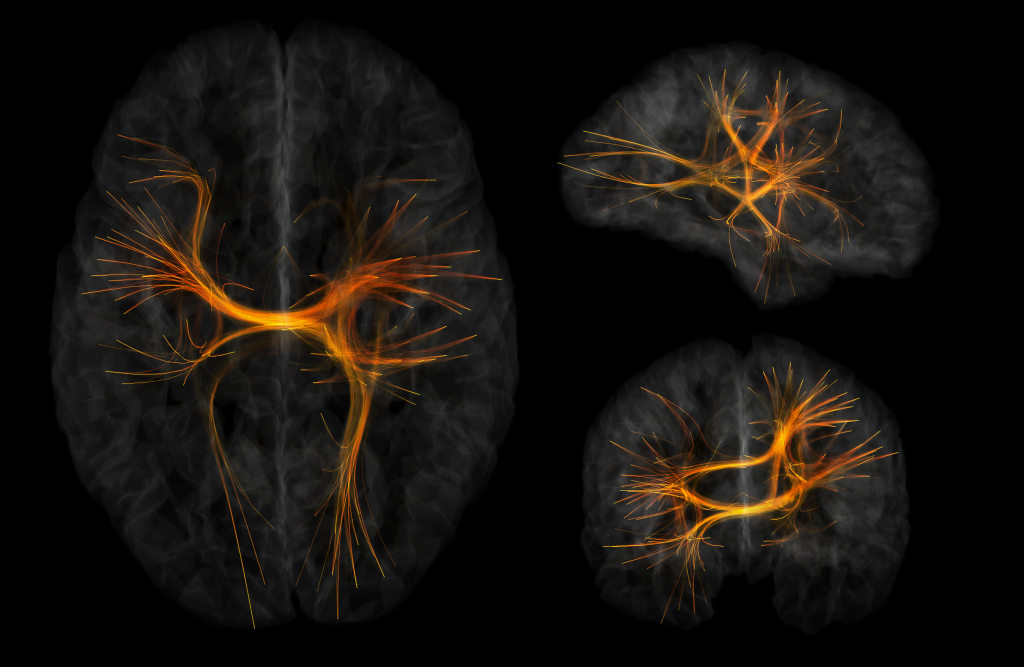
The image shows the application of a prototype visualization method using white-matter segmentation and spline-bundle to a simulated MEG source connectivity analysis. Dataset consist of an activation pattern involving a causality relationship between different cortical region using over 5000 regions of interest and the corresponding number of links in between them. Using multiple thresholding methods jointly with a novel 3D brain space visualization, the graph brings visually informative display of the underlying simulated network. While the bundle pathways are not DTI based, the segmentation process is able to present anatomically coherent display.