Joachim Böttger, Ralph Schurade
Max Planck Institute for Human Cognitive and Brain Sciences, Leipzig, Germany
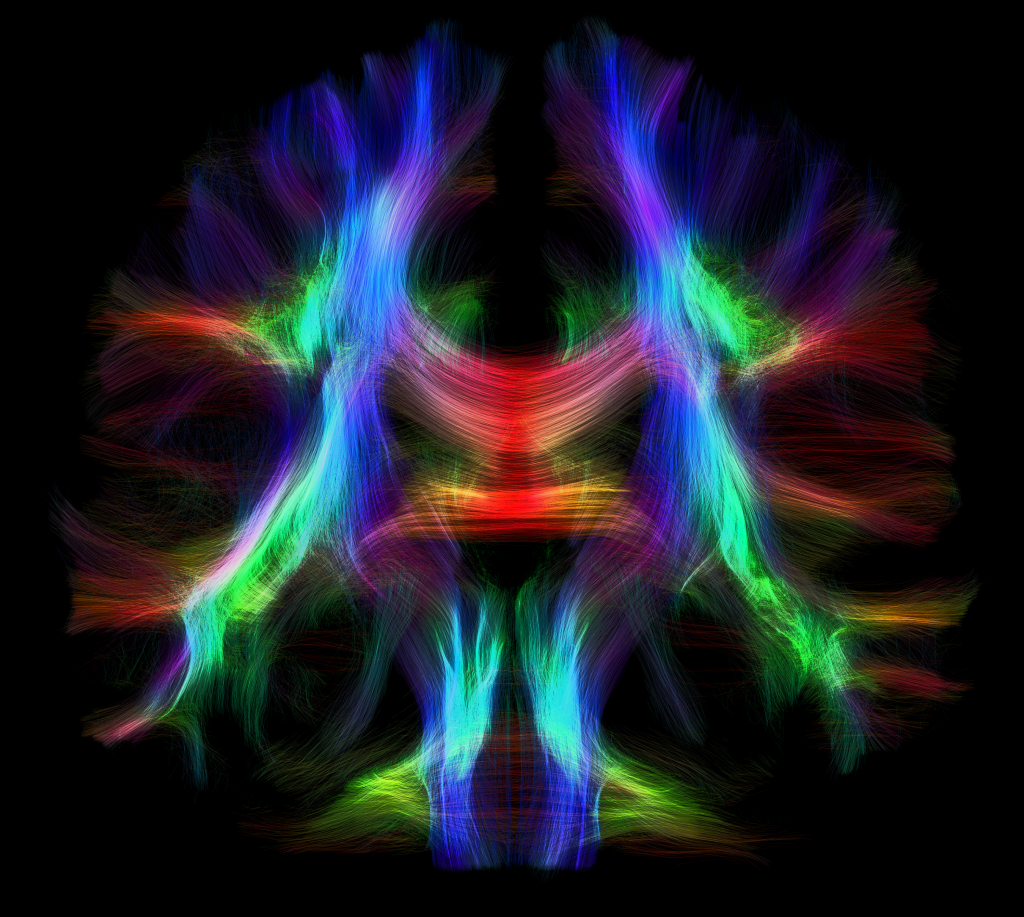
Subsequent to a high resolution whole-brain fiber tracking, we only include those parts of the fibers contained in a thin slice of a few millimeters in this illustration. The single lines follow the direction of diffusion as measured with diffusion weighted imaging. The colors are calculated from the local orientation of the fibers: red for lateral connections, green for fibers running from the front to the back, and blue for ascending or descending fibers. We used braingl, a software available at code.google.com/p/braingl, to render the fibers with a combination of depth peeling and a weighted averaging. The software enables the interactive exploration of data as shown in this image.